Know what drives growth. See what it takes in cash.

Financial modeling connects the drivers of your business to revenue, margins, and cash so you can test decisions before committing capital. Bridges builds Excel operating models for B2B SaaS companies with contracts, transactions, and usage-based revenue. Starting from $10,000 one-time.

Clear options when the cash decision matters

Founders work with Bridges to fund growth, navigate downturns, and prepare for their next raise

Case study

How a pre-revenue lending SaaS got fundraise-ready in two weeks with Bridges

A pre-revenue lending platform for U.S. infrastructure contractors needed to raise equity and a debt facility at the same time. Bridges built separate but interlocked operating and credit models, so each investor group could stress-test its own story.

Read the case study

2 weeks

Model delivered

Dual-capital

Equity + debt structured separately

85%

Advance rate on credit facility

Turn your operating plan into better capital decisions

Connect the drivers of your business to scenarios and key metrics. See how you're pacing, compare growth investment with preserving liquidity, and give the team a shared basis for its next decision.

Drivers you can act on

Focus on the few changes in acquisition, retention, pricing, or usage that matter most to your business.

Scenarios that guide capital

Test slower sales, higher churn, or later hiring. See revenue, margins, and runway change before committing.

Metrics that explain performance

Track the revenue, unit economics, and cash measures that show whether the plan is working.

A model of your revenue, costs, and growth plan

Built around how your business works

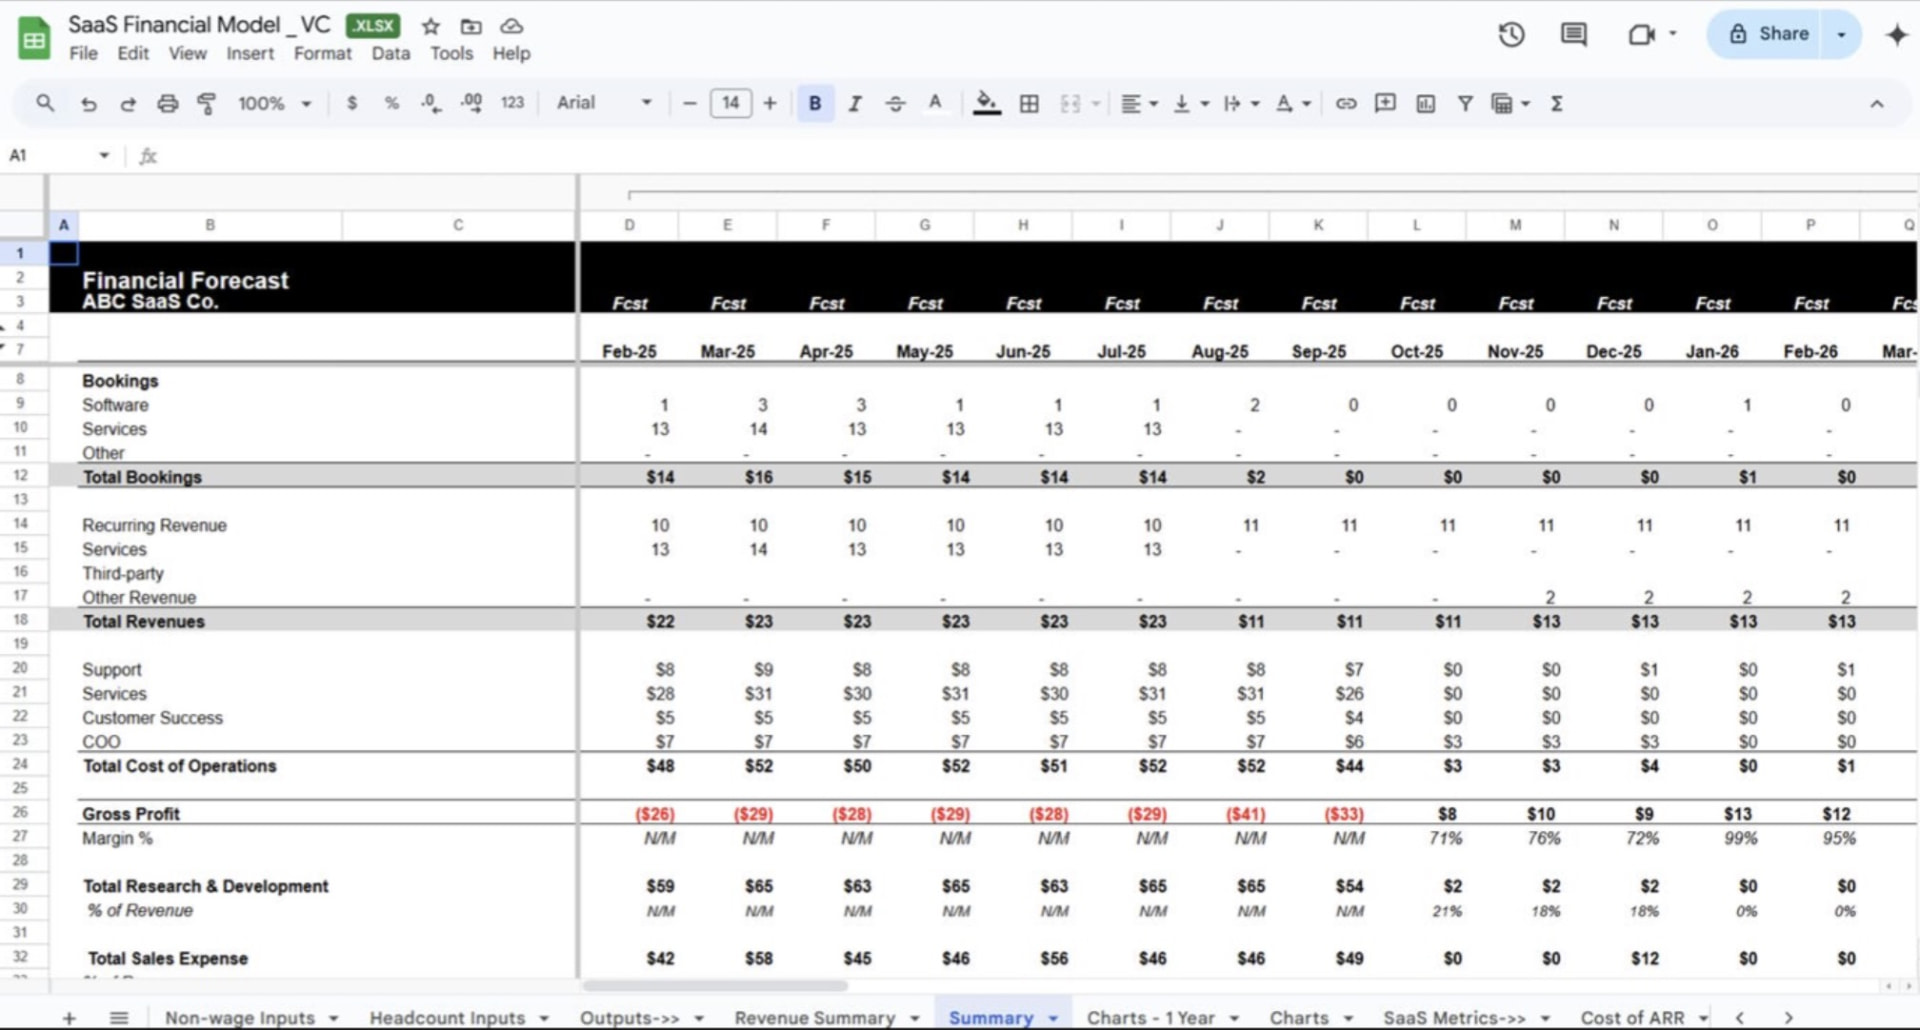
Ground subscription, usage, and payments forecasts in actuals, with revenue and costs by service. Link the P&L, cash flow, and balance sheet to your growth plan.

Work with Bridges

Revenue by service

Annual contracts, monthly SaaS, payments, and transactions each follow their own drivers. Keep revenue, billing, and cash timing distinct.

Unit economics

Connect each revenue stream to its direct costs so growth does not hide weak margins. Servers for SaaS. LLMs for usage. Processor costs for payments.

Growth modeling

Model rep hiring and ramp, quota attainment, and commission structure against the revenue plan. See what the sales team can deliver and what that growth costs.

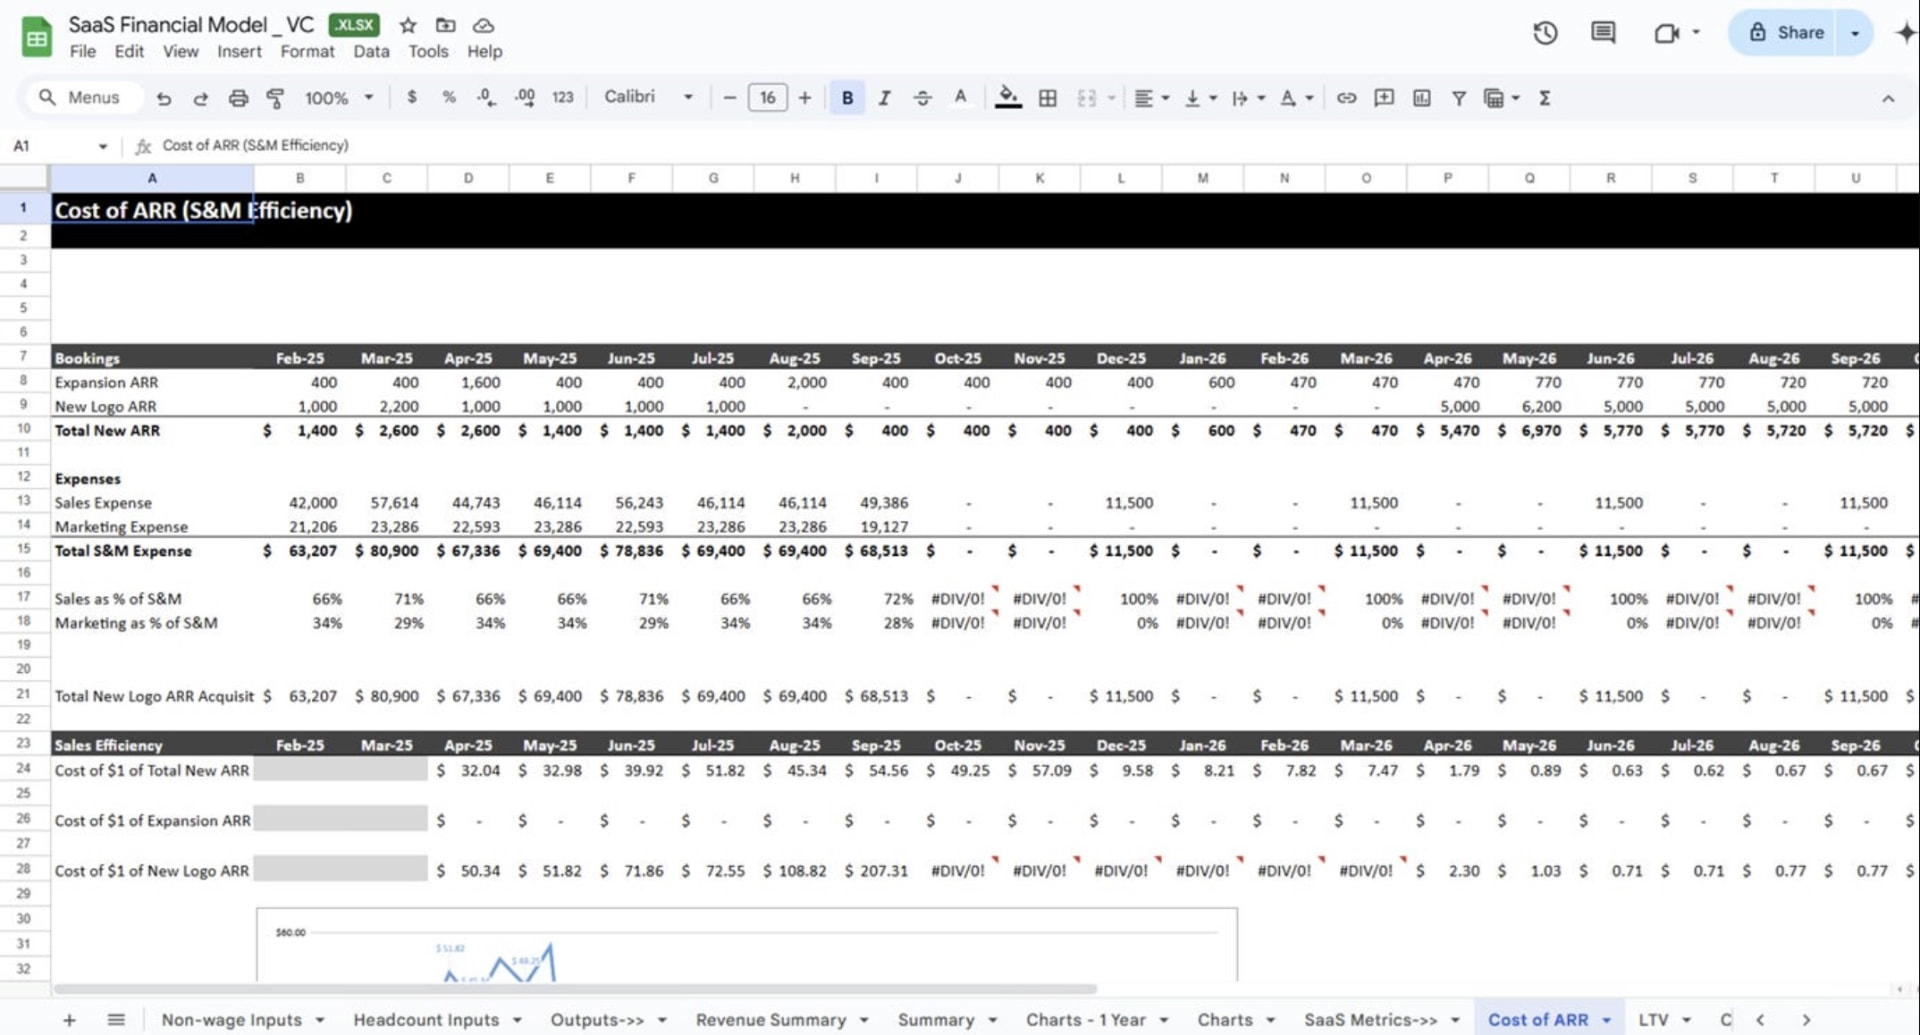
Efficiency analysis

Model hiring dates, salaries, and benefits by department. Connect non-payroll costs across sales, product, and admin to growth.

Starting from

$10,000

one-time, starting price

Tim Salikhov, The Payments CFO

Over 350 B2B SaaS models built since my investing days at Lazard, through the $1B Kabbage sale, and leading finance orgs.

Tim Salikhov, CFA

The Payments CFO

Meet the team

See the economics behind the growth

The scorecard should match how your company earns and spends. Choose the measures that explain the primary drivers, rather than importing every SaaS metric.

Revenue and service margins

Track subscription revenue, usage, and payments alongside gross margin by service. Separate payment volume from platform earnings so revenue growth does not hide weaker economics.

Revenue and service margins

Customer growth and acquisition payback

Bridge starting subscription revenue to new customers, expansion, contraction, and churn. Track cohort CAC payback separately from payments and usage economics.

Customer growth and acquisition payback

Cash runway and year-end outlook

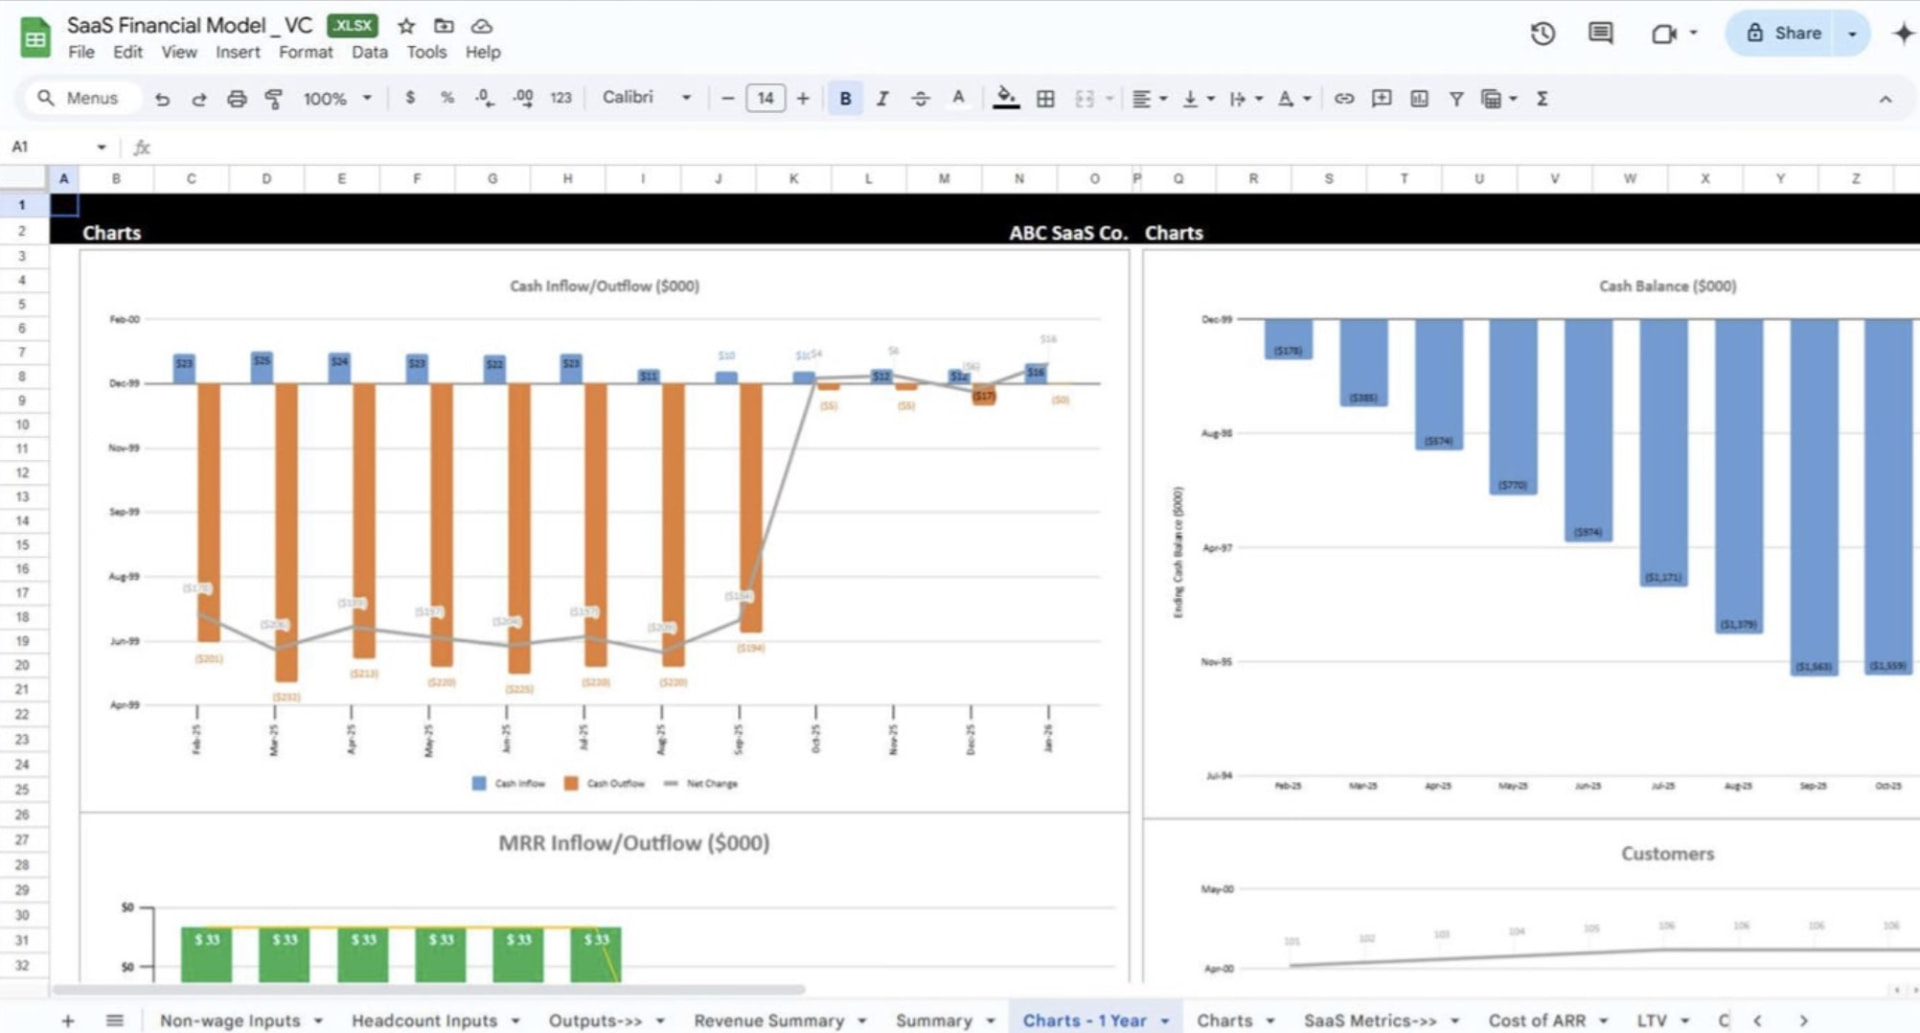
Compare actuals with plan and update the year-end cash outlook. See how collections, hiring, and seasonal changes affect runway before committing more capital.

Cash runway and year-end outlook

From business interviews to a model your team can use

The process runs over 2-4 weeks, from understanding the business to presenting, testing, and refining the model with your team.

Week 1

Understand the business

Interview the founder and team to understand how the business works, how it earns revenue, and the decisions the model needs to support.

Weeks 2-3

Build the model

Build drivers, scenarios, reporting across SaaS, payments, costs, and sales capacity. Mark inputs, protect formulas, and model quotas and commissions.

Weeks 3-4

Present and refine

Present outputs and join the strategy meeting. Review assumptions, inputs, and charts. Gather feedback, refine, and deliver the final model.

What would change your next capital decision?

Tell us the decision ahead. We’ll connect your growth plans to the revenue, margins, and cash needed to make it.

Book an Intro Call

FAQ about financial modeling

What is financial modeling for a SaaS company that processes payments?
It is an operating model that connects contracts, transactions, and usage to revenue, costs, and cash. Separate service economics help you see whether subscription growth and payments growth create the same financial outcome.
Can a small set of drivers represent a complex business?
A few primary drivers can organize the model without erasing the detail beneath them. Supporting assumptions still capture pricing, retention, direct costs, and timing; the goal is to focus the team on the levers it can change.
Should transaction and usage revenue count as ARR?
Not automatically: contracted subscription ARR and annualized variable revenue measure different things. State the definition, keep one-time revenue separate, and show the variable revenue streams alongside the recurring base rather than hiding them in one headline number.
How do annual contracts change cash planning?
Contract value, recognized revenue, and cash collections can move on different schedules. An annual prepayment can fund growth sooner than monthly collections, while deferred revenue and future service costs still need to be reflected in the model.
How should we measure acquisition efficiency across services?
CAC payback should account for the gross profit earned after direct costs, not revenue alone. Segment or cohort detail can reveal differences in retention and payback that a blended average hides; cash collection speed is a separate view of funding capacity.
Is ongoing forecasting part of the model build?
The one-off project builds a three-year operating model with scenarios. Ongoing cash and runway planning starts in Cash Management; Strategic Finance goes deeper with forecasts, budgets, and analysis. The initial model build is included in a monthly retainer.
What does a financial model cost, and how long does it take?
Financial modeling starts from $10,000 one-time, with a 2-4 week build window. The approved scope is a three-year Excel operating model with scenarios built around contracts, transactions, and usage; see /pricing for the service price.