
Embedded Payments as a Revenue Engine: A Vertical SaaS Growth Playbook
Embedded payments can be 70%+ of a vertical SaaS platform's revenue. Which monetization model you run, how you price it, and how many merchants actually use it decide whether you capture that.
Embedded payments is the highest-leverage revenue lever most vertical SaaS platforms have available to them — and also the one most commonly built and then left to underperform. At scale, payments revenue dwarfs software subscriptions: Shopify's merchant solutions run around 73% of total company revenue versus roughly a quarter from software, and Mindbody earns more than half of total revenue from financial products, not software. The gap between what's possible and what most platforms actually capture comes down to three decisions — which monetization model to run, how to price it, and how to get merchants to actually use it.
- The monetization model determines 5–10x of your revenue on identical volume. A referral/ISO arrangement generates 5–15 bps net on GPV; a PayFac-as-a-Service deal generates 50–150 bps on the same transactions — before a single new merchant is added.
- Attachment rate is the highest-leverage metric in embedded payments. Most platforms stall at 15–20% of eligible merchants actively processing on-platform. Moving from 20% to 60% attachment on a 2,000-customer base at $10K/month average volume adds $4M/month in GPV without a single new logo.
- Full PayFac registration only pencils out above ~$50M/year in processing volume. Setup costs roughly $500K and $100K+/year to maintain — below that threshold, PayFac-as-a-Service captures nearly the same economics without the liability.
- Your pricing ceiling is driven by product comprehensiveness, not competitor rates. Fitness studios routinely accept 3.5–3.9% from platforms that also handle scheduling and membership — because they're evaluating total software value, not the payments line in isolation.
- Revenue recognition (gross vs. net) doesn't change your cash, but it changes how growth looks. On $100M in annual GPV at a 3% merchant fee, net recognition books $700K at near-100% margin; gross recognition books $3M at roughly 23% margin — the same profit, reported very differently.
The revenue math, first
Payments revenue scales with your customers' transaction volume, not your seat count — it turns a capped subscription line into a usage-based one.
The number to build your model around is take rate — your net payment revenue as a percentage of gross payment volume (GPV). GPV itself is not revenue; it's the scale metric investors anchor to, the same way GMV is tracked for marketplaces. Take rate is what converts that scale into actual economics, and it varies by an order of magnitude depending on which monetization model you choose:
| Model | Typical net take rate | On $50M/year GPV |
|---|---|---|
| Referral / ISO | 5–15 bps | $25,000–$75,000/year |
| Integrated / fee-on-top markup | 10–30 bps | $50,000–$150,000/year |
| PayFac-as-a-Service (PFaaS) | 50–150 bps net | $250,000–$750,000/year |
| Full PayFac registration | 50–100+ bps net | $250,000–$500,000+/year |
The gap between the cheapest model to set up (referral) and the model most platforms should actually run (PFaaS) is routinely a 5–10x revenue difference on identical processing volume. That is the most consequential decision in this entire guide.
Why the gap is so large: what each model actually is
Referral / ISO (independent sales organization). You refer merchants to a processor and earn a small residual — historically the lowest-effort, lowest-revenue path. You don't underwrite, don't hold merchant accounts, don't touch compliance, and don't own the merchant relationship. This model controlled roughly 60% of payment processing as recently as 2018; by 2026 that share has fallen to under 20% as embedded models displaced it.
Integrated payments (fee-on-top / markup). You set a price above your processing cost and keep the spread — for example, cost 2.5%, charge 3.2%, keep 0.7%. This is a step up from referral in revenue but doesn't give you the underlying control — pricing flexibility, merchant experience ownership, data access — that the two embedded models below do.
PayFac-as-a-Service (PFaaS). You get the economic and control benefits of being a payment facilitator without registering as one yourself. A licensed provider (Stripe Connect, Finix, Payrix, Adyen for Platforms, Rainforest, Stax Connect) is the registered PayFac technically, carrying the sponsor-bank relationship, underwriting, and most compliance liability, while you earn 50–90% of the net processing margin depending on the deal. This is where most vertical SaaS platforms should live, and it's live-able in one to four months. According to Finix's analysis of the PayFac vs. ISO decision, a $10M/month platform on a genuine 75% revenue-share PFaaS deal can generate roughly 700–1,000% more monthly payment revenue than the same volume under a traditional referral arrangement.
Full PayFac registration. You become the merchant of record directly — full control, full economics, full liability. This costs roughly $500K to launch and $100K+/year to maintain, takes 12–18 months, and only pencils out above roughly $50M/year in processing volume.
The question to ask any PFaaS provider is not "what's your rate" — it's two specific ones: "Is this a true processing-margin revenue share, or a fixed referral fee?" and "Can I set merchant pricing above your cost, and keep the spread?" Some providers marketed as PFaaS are structurally closer to a referral arrangement with better branding.
The difference between a PayFac and an ISO: visual breakdown
The diagram shows how operational responsibility shifts across the four models — from left (ISO, where the provider manages nearly everything) to right (full in-house PayFac, where your platform manages nearly everything). The middle two models — outsourced to a PayFac and becoming a PayFac with an enablement partner — are where most vertical SaaS platforms land in practice.
Key items the platform begins managing as it moves right: PCI Level 1 certification, a payment operations team, registration with the networks, merchant underwriting, fraud detection, reconciliation, and disputes. Payment forms and payouts remain platform-managed across all four models.
Picking your model by stage
Below ~$1M/month GPV: optimize for speed and low fixed cost, not maximum margin capture. Stripe Connect gets you live in weeks with no meaningful upfront cost and the best developer experience of any option. Accept that the economics are thinner than a dedicated PFaaS deal — that's the price of speed at a stage where speed matters more than basis points.
$1M–$5M/month GPV: re-price. If you're still on Stripe's flat-rate structure, this is the point to run a real RFP against Finix, Payrix, and Stax Connect, benchmarking actual interchange-plus buy rates and revenue-share terms. Migrating to a white-label PFaaS relationship here typically moves you from the 10–30 bps range toward 50–100 bps on the same volume.
$5M–$20M/month GPV: you now have real negotiating leverage. Push acquirers on markup, add instant-payout monetization if your vertical values payout speed, and start evaluating whether Adyen for Platforms makes sense for your top end.
Above ~$50M/year (roughly $4M+/month sustained): model full PayFac registration seriously, but only register if the net incremental basis points on your actual volume clearly exceed the ~$500K setup and ~$100K+/year ongoing compliance cost. For many platforms, staying on a white-label PFaaS relationship indefinitely is the right call even at this scale.
The provider shortlist and how to evaluate them
Score any provider you're evaluating on: pricing structure and true buy rate at your current and projected volume; whether the revenue share is genuine processing-margin sharing versus fee-on-top; integration complexity and time-to-first-transaction; hardware support if you have in-person volume; sub-merchant onboarding speed and who underwrites; who is legally merchant of record and who owns PCI/chargeback/fraud liability; payout timing and instant-payout options; and — critically — whether merchant agreements and the tokenized card vault are portable if you leave.
- Stripe Connect (+ Terminal) — fastest to launch, best developer experience, no fixed cost, thinner economics than a dedicated PFaaS deal, and no direct graduation path to full PayFac registration.
- Finix — a direct processor connected straight to the card networks, removing a markup layer, with both PFaaS and a path to full PayFac registration on the same technical stack. More integration work upfront than a drop-in checkout.
- Payrix (Worldpay for Platforms) — one of the original ISV-focused PFaaS providers, now backed by Worldpay/FIS scale, with interchange-plus pricing and markup control. Some reported onboarding and support friction worth weighing.
- Stax Connect — subscription pricing (flat monthly fee instead of a percentage markup) that favors high-ticket, predictable-volume merchants; strong US/Canada SMB depth with high-touch onboarding support.
- Adyen for Platforms — the strongest option for omnichannel and international at the lowest effective cost, but enterprise-oriented with a minimum monthly invoice and sales-led onboarding. Compelling near the top of a growth-stage platform's volume range, not at the start.
- Rainforest — purpose-built for vertical SaaS platforms, with a focus on enabling fast PayFac-as-a-Service relationships and transparent pricing for software-led payment programs.
The adoption problem: the highest-leverage lever most platforms ignore
Here's an uncomfortable finding from independent benchmarking of vertical SaaS payments programs: most platforms set an adoption target around 71% of eligible merchants actively using their embedded payments product, and only about a quarter of platforms actually reach it. The much more common pattern is a stall at 15–20% adoption that never breaks through.
The math explains why moving attach rate matters more than shaving basis points. A platform with 2,000 customers, 40% attachment, and $10K/month average merchant volume has $8M/month in GPV; moving to 60% attachment adds $4M/month in GPV without acquiring a single new customer. Cutting your processing costs by 5–10 basis points through renegotiation is a rounding error next to that.
The levers that move attach rate, in rough order of impact:
- Make on-platform payment the default, not an opt-in add-on. Platforms that stall at 15–20% adoption typically have payments living behind a secondary menu item labeled something like "Get Paid." Platforms that break through embed payment collection directly into the workflow the merchant is already doing — the quote, the invoice, the booking confirmation.
- Sell it in the demo, not as a follow-up email. If your sales reps aren't trained to talk about payments as part of the core value proposition during the initial sale, adoption becomes a second, harder sales motion after the merchant is already onboarded and has existing processing habits to unwind.
- Give merchants a concrete reason beyond convenience. One field-services platform reduced a customer's accounts receivable by 70% simply by tying payment collection to the invoice workflow. That's a number reps can sell.
- Staff proactive payments support, not reactive. Payment disputes, onboarding blocks, and frozen accounts are high-stakes tickets that a generalist support team without payments context can't resolve effectively — and a bad first experience with your payments product kills adoption for that merchant permanently.
- Run a phased go-to-market. Launch with a small beta group to validate onboarding flow, payout timing, and reconciliation before rolling out broadly. Only then start experimenting with pricing tiers and value-added monetization.
According to Stripe's analysis of revenue models for embedded payments, the platforms capturing the highest share of addressable GPV consistently treat payments as a core workflow feature, not a monetization add-on.
Who owns this inside your company
The most consistently cited internal failure mode is the absence of a dedicated payments leader with real executive sponsorship — payments buried under finance, or treated as a shared responsibility with no single owner, reliably underperforms. Independent data puts the value of having a dedicated payments leader at roughly 45 basis points of median take rate — one of the biggest levers in this entire guide, and one that's purely organizational, not technical.
- Executive sponsorship before the first hire, not after. Leadership needs to visibly signal that payments is a company priority before a payments leader's first day, or that person spends their first six months fighting internal indifference instead of building.
- Cross-functional ownership, not a silo. Sales needs comp plans that reward attach, not just software ARR. Support needs payments-specific training. Product needs a payments roadmap that isn't perpetually deprioritized behind core feature work.
- Sales compensation is a specific trap: reps trained to sell subscription software often default to a "match or beat your pricing" posture when a prospect objects to payment fees, which quietly erodes take rate even when the product delivers real value that exceeds the quoted price.
Bridges works with payments and fintech SaaS founders specifically on these organizational transitions — determining when to make a dedicated payments hire, how to restructure sales comp to reward attach rate, and how to model the revenue impact of moving from ISO/referral to PFaaS.
Revenue recognition: a choice that changes how your growth looks, not your cash
Whether you recognize payment revenue gross or net (the accounting question of whether you're acting as principal or agent under ASC 606) doesn't change your actual cash profit, but it dramatically changes how your growth looks to a board or an investor.
Net recognition books only your spread — typically 15–70 bps — at near-100% margin. Gross recognition books the entire merchant fee, often 4x the net number, but at a much lower blended margin (often in the 20–30% range once payments dominates the revenue mix).
On $100M in annual GPV at a 3% merchant fee with 2% in passthrough costs and 30 bps in provider fees: net recognition books $700K in revenue at close to 100% margin, while gross recognition books $3M in revenue against $2.3M in cost — the same $700K profit, reported at a 23% margin instead of a near-invisible cost line.
This is precisely why a company can report payments as 70–80% of total revenue while its blended gross margin looks structurally compressed. Align with your CFO and investors on which method you're using and why before payments revenue becomes material enough that the choice draws questions. Bridges helps founders model both scenarios and present them clearly to boards before they draw the wrong conclusion from a compressed margin line.
Deciding your pricing structure: blended, interchange-plus, or bundled
Two mechanical terms are worth knowing before you set a number. Card pricing is quoted as a volume fee (a percentage of the payment) plus a per-item fee (a flat amount per transaction, e.g. the "$0.30" in "2.9% + $0.30"). Volume fees matter more to merchants with large average tickets; per-item fees matter more to merchants with small ones — a $0.30 per-item fee is 30 bps on a $100 transaction but only 3 bps on a $1,000 one. Knowing your merchants' average ticket size tells you which lever they'll actually notice.
- Interchange-plus (IC+) passes through the exact interchange and network cost on every transaction, plus a disclosed markup on top. It's the most transparent and lowest-cost structure for the merchant, but it exposes your margin on every statement and invites large or sophisticated merchants to negotiate that markup down directly. Right almost exclusively for very large merchants with finance teams built to monitor processing costs.
- Blended (flat) pricing — a single volume fee plus per-item fee, like 2.9% + $0.30, regardless of underlying interchange — is simple for merchants to understand, easy to bill and reconcile, and lets you keep interchange-optimization savings. For most vertical SaaS platforms, this is the right default.
- Bundled pricing folds your software subscription into the payments rate entirely — instead of $99/month plus 3% on payments, you charge a single 5% rate and the core product is included. It adds a wider margin cushion against interchange variability and frames payments as inseparable from the platform rather than a line item merchants can shop against outside processors. To convert an existing subscription fee into a bundled rate, express the annual fee as a percentage of the customer's expected annual processing volume and add it to your payments price range — a $5,880/year software fee against a customer processing $1M/year adds roughly 59 bps on top of whatever payments range you land on.
Setting your price ceiling: what merchants will actually pay
The ceiling is driven far less by matching competitors' rates than by how comprehensive and vertical-specific your core product is.
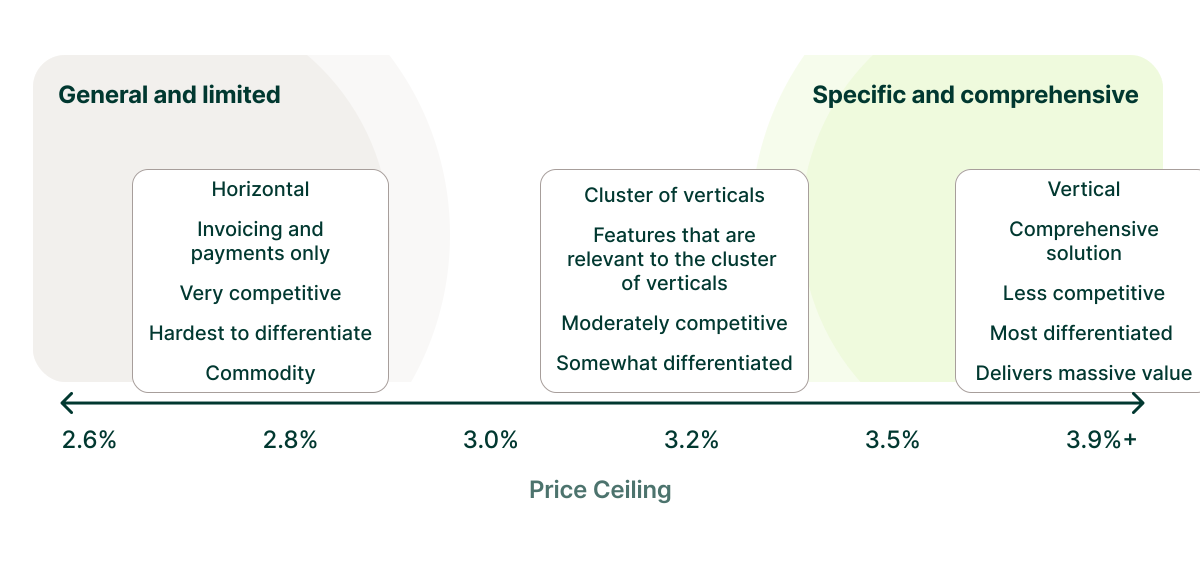
A horizontal, commodity-feeling product (invoicing and payments, nothing else) in a crowded market has the lowest ceiling, typically 2.7–3.0% all-in. A moderately differentiated product with some workflow stickiness can support 2.9–3.5%. A genuinely comprehensive, vertical-specific "operating system" for an industry can support 3.2–3.9% or more, even in objectively thin-margin verticals. Fitness studio software is the clearest real-world proof: studio owners running low-margin businesses routinely accept a 3.5–3.9% payment fee from platforms that also handle scheduling, class sign-up, and membership billing, because they're evaluating the software's total value, not the payment line in isolation.
Within whatever ceiling your product category supports, what separates a platform charging 3.2% from one charging 3.9% for an equally comprehensive product is merchant experience: fully embedded flows with no redirects, reliable uptime, real-time payment status, predictable consolidated deposits, and transparent reporting.
Setting your price floor: cost-based pricing
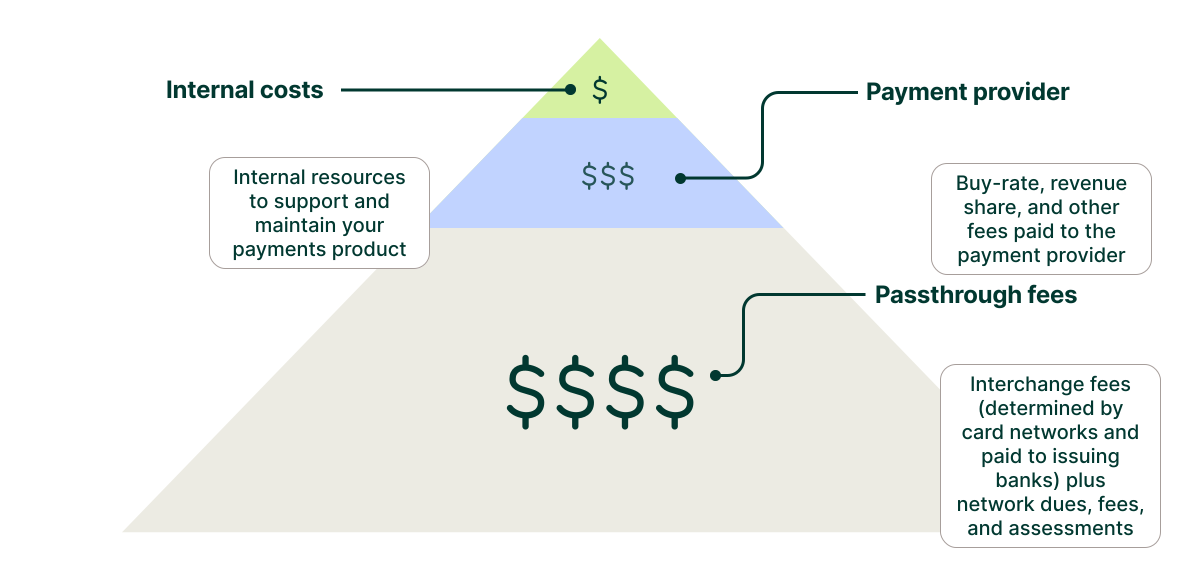
The floor is mechanically simpler: passthrough costs (interchange plus network dues and assessments) plus your payment provider's fees plus your desired margin. Passthrough rates vary meaningfully by vertical and transaction profile. As a starting estimate per Rainforest Pay's embedded payments pricing analysis, expect roughly:
| Transaction type | Estimated passthrough range |
|---|---|
| Low-ticket in-person B2C | 1.6–2.0% |
| High-ticket in-person B2C | 1.8–2.3% |
| Low-ticket online B2C | 1.9–2.3% |
| High-ticket online B2C | 2.2–2.6% |
| Non-profit | 1.5–1.9% |
| B2B | 2.4–3.0% |
Source: Rainforest Pay, Embedded Payments Pricing Essentials.
Two worked examples make the floor concrete. A healthcare platform processing $200M/year at a $250 average ticket, with an estimated 2.1% passthrough, 20 bps in provider fees, and a 50 bps margin target, has a minimum viable price around 2.8%. A B2B services platform at $500M/year with a $3,000 average ticket, 2.6% passthrough, 15 bps provider fees, and a 25 bps margin target lands at roughly a 3.0% floor.
If your bottom-up floor comes out higher than your top-down ceiling, that's a signal, not a dead end. It usually means the core product isn't differentiated enough yet to support premium payments pricing — and the fix is rarely to price payments at cost. It's to make the software valuable enough that payments pricing stops being the thing merchants scrutinize.
Two pricing myths worth retiring
Two beliefs quietly cost platforms real revenue. The first is that migrating a merchant off their existing processor requires matching or beating their current price. It doesn't — merchants switch for value, not for a marginal discount. One platform tested this directly: offering large existing merchants a full percentage point of savings, worth six figures a year on their volume, to migrate produced almost no response. What actually moved them was integrating payments deeply into features they already relied on and sunsetting support for the legacy processor.
The second myth is that price is the primary lever on adoption and usage. It mostly isn't: the majority of what a merchant pays is passthrough cost you don't control, so even cutting your own margin in half typically saves the average merchant an amount too small to change their behavior, while permanently shrinking the resources available to improve the product.
As Paddle's analysis of build vs. buy in payment acceptance makes clear, the platforms that squeeze the most revenue from payments do so through workflow integration and product depth — not by racing to the bottom on price.
Monetizing ACH separately from card
ACH deserves its own pricing decision rather than a default extension of your card rate, because banks charge ACH as a flat fee rather than a percentage — which gives you real structural flexibility that card interchange doesn't allow. Three structures cover most cases:
- Flat fee per payment — revenue tracks to payment count; fits industries already accustomed to flat ACH pricing (finance, utilities, finance-adjacent B2B).
- Straight percentage — revenue tracks to volume; works where merchants care more about getting paid reliably than about optimizing cost.
- Percentage with a cap — protects large-ticket merchants from an uncapped fee while still capturing volume-based revenue below the cap.
B2B and high-ticket B2C merchants tend to accept a volume fee in the 0.5–1.5% range with a cap around $5–$10 per payment. Because card volume is almost always more valuable than ACH volume, it's reasonable to make card the path of least resistance — presenting it first in the payment flow, reserving ACH for higher-tier customers — while keeping ACH a real option rather than an afterthought.
Go-to-market tactics for a payments launch or relaunch
- Start higher than feels comfortable. It's far easier to lower a price later than raise one — but make sure merchant agreements explicitly reserve the right to change fees on notice, so you're not contractually stuck with an early number.
- Treat your initial rate as a hypothesis. Promote it to early adopters, watch what objections come back, and adjust positioning or pricing from real signal instead of guesswork.
- Frame the launch as an upgrade, not a new cost. If you're replacing a mediocre processor experience or adding payments where merchants previously had to leave your platform entirely, the messaging should carry that energy rather than apologize for a new line item.
- Decide upfront whether refunds carry the same fee as the original payment. In competitive markets, charging only a per-item fee on refunds — not the volume fee — is the norm.
- List the payments price alongside your core software pricing, never as a separate conversation. Every time payments is priced independently of the platform, you're teaching merchants to evaluate it as a commodity instead of a feature of the product they already value.
- When merchants ask for a rate review, gate real statement-by-statement comparisons behind a volume threshold. Give frontline reps room for a small discount without a full review; reserve the labor-intensive true-cost comparison for merchants large enough to justify the effort.
The sequencing rule: pick a defensible price and launch rather than over-engineering the number, spend energy on adoption rather than shaving margin, and only turn to interchange optimization once volume is real — a 5% reduction in your passthrough rate typically moves your margin as much as a 50% cut to your own provider fees.
What comes after payments: the embedded fintech ladder
Payments is the entry point, not the ceiling. The transaction data generated by processing payments is what makes every subsequent financial product cheaper to build and safer to underwrite.
The sequence that's worked at scale: payments first (universal need, establishes the data relationship), then lending (your merchants' transaction history makes them dramatically more underwriteable than a bank customer walking in cold), then banking/deposit accounts, then card issuance.
Shopify is the clearest public case study: Shopify Payments, then Shopify Capital (lending, $1B+ originated), then Shopify Balance (banking), then a Shopify-branded card. Each layer deepens the merchant relationship, raises revenue per customer, and makes the platform substantially harder to leave. As Stripe's revenue model analysis notes, a large share of the embedded finance market remains untapped, concentrated precisely in this lending/banking/card-issuance expansion beyond payments.
Your payment processor is not automatically your embedded finance partner. A processor optimizes for transaction volume; lending, banking, and card issuance require different regulatory licenses, risk models, and banking relationships that most PSPs don't provide natively.
What this is actually worth: the valuation lens
Embedded payments doesn't just add revenue — it's a demonstrated valuation multiplier. The framework investors use comes down to three compounding variables: attach rate (what percentage of your customers actually process on-platform), volume per merchant, and take rate. Improving any one of these helps; improving all three simultaneously compounds.
One property management platform's growth from $2B to $10B in annual processing volume contributed to a reported 446% valuation increase ahead of a $580M acquisition — one of the more concrete, publicly referenceable data points connecting payments execution directly to exit value.
The practical implication: if you're already live with payments and attach rate is under 50%, or you're capturing meaningfully less than your modeled take-rate opportunity, that gap is monetization upside available without a single new logo — often the highest-ROI initiative on your roadmap.
FAQ: embedded payments and monetization terms, defined
A PayFac (payment facilitator) registers directly with Visa/Mastercard as a master merchant and assumes full fraud and chargeback liability for sub-merchants. PayFac-as-a-Service gives you the same economic and control benefits—setting pricing, white-labeling the experience, owning the merchant relationship—without registering yourself. A licensed partner is the technical PayFac and carries the compliance burden. Most vertical SaaS platforms should use PFaaS and only consider full registration once volume (roughly $50M+/year) justifies the cost and liability step-change.
An independent sales organization resells payment processing on behalf of an acquirer—you refer merchants and earn a small residual (5–15 bps) without underwriting, holding merchant accounts, or owning the relationship. It's the lowest-effort model and the lowest-revenue one. It's fallen from roughly 60% market share in 2018 to under 20% by 2026 as embedded models proved out.
A business onboarded under a PayFac's (or PFaaS provider's) master merchant account. The card networks see only the PayFac—the sub-merchant is invisible to Visa and Mastercard directly, and all accountability flows through the PayFac. Every merchant on your platform using Stripe Connect or an equivalent PFaaS integration is a sub-merchant of that provider.
The merchant of record is the legal entity accountable to the card networks for a transaction—responsible for compliance, chargebacks, and tax obligations. In a PFaaS model, your provider is typically the MoR, not your platform or your merchant. This matters for monetization because MoR status is often bundled with pricing control—confirm specifically whether being (or not being) the MoR affects your ability to set merchant-facing pricing under a given provider's terms.
Embedded payments means the platform owns the payment experience, data, and economics natively inside the product—sign-up, acceptance, payouts, and reporting all happen without redirecting to a third party. A bolted-on payments feature (a link out to a third-party checkout, a basic referral integration) doesn't capture the monetization upside or the retention benefit, because the platform doesn't own the relationship or the data. The difference is economic and architectural, not cosmetic.
Take rate is your net payment revenue as a percentage of total GPV—the metric investors anchor payment valuation discussions to. It is not the same as gross margin: a 100 bps take rate sounds strong, but if your effective cost of acceptance eats 85 bps of that, your actual margin is only 15 bps. Always calculate net take rate after passthrough costs, not the headline percentage you're charging merchants.
A residual (or revenue share) is your ongoing income based on a percentage of processing volume or margin, per your agreement with a processing or PFaaS partner. It's common enough for platforms to be underpaid on residuals that it's worth an independent check against raw settlement data, not just the summary report your provider sends.
The percentage of your eligible merchant base actively using your embedded payments product. It's the single highest-leverage lever in embedded payments monetization because most platforms have far more room to grow by capturing existing addressable volume than by optimizing margin on volume they've already captured. Most platforms stall at 15–20% attachment. The levers that break through are workflow-embedded (not opt-in) payment collection, sales enablement at the point of sale, and a dedicated payments-support function.
A volume fee is a percentage of the payment amount (the '2.9%' in '2.9% + $0.30'); a per-item fee is a flat charge per transaction (the '$0.30'). Volume fees scale with ticket size and matter more to merchants with large average transactions; per-item fees are fixed and matter more to merchants with small ones—the same $0.30 fee is 30 bps on a $100 sale but 3 bps on a $1,000 sale. Knowing your merchant base's average ticket tells you which number they'll actually notice on their bill.
For most vertical SaaS platforms, blended or bundled pricing is the better default—simpler to bill, easier to reconcile, and it lets you keep interchange-optimization savings instead of passing them straight through. Interchange-plus is more transparent and lower-cost for the merchant, but it exposes your margin on every statement and invites negotiation. It's the right fit almost exclusively for very large, sophisticated merchants who already have finance staff to monitor processing costs directly.