
Strategic Finance for B2B SaaS Companies That Process Payments

B2B SaaS companies that process payments trust Bridges to analyze cost efficiency, plan revenue, manage cash flows, and plan headcount around revenue that moves with every customer transaction.

B2B SaaS founders who process payments replace cash-flow guesswork with a forecast they can act on

Bridges has managed $900M+ of P&L for 30+ companies. Here is what founders say.

“Tim brought financial clarity that let us scale profitably, grow the team, invest in sales & marketing, and move fast without worrying about cash or risk.”
Levon BrutyanLevon BrutyanCo-Founder & CEOCollectly · Healthcare SaaS
“We overstaffed to meet demand. Then pipeline dried up, margins collapsed, payroll at risk. Tim showed path to profit and gave me confidence to act.”
Jacki LeahyJacki LeahyCEOActivate the Magic · GTM SaaS
“We expanded too fast, but underestimated our cash needs. Tim modeled our options which helped get our investors back on board.”
Nick SteeleNick SteeleCFOStimLabs · Life Sciences SaaS
“Tim navigated Kabbage through near-zero runway — bringing financial discipline and analytical rigor — and prepared us for a premium exit.”
Rob FrohweinRob FrohweinCo-Founder & CEOKabbage · SMB SaaS

A cash forecast built on payment volume and processing costs holds up where standard SaaS models break

Standard SaaS models assume steady subscription revenue. When part of your revenue moves with customer transaction volume, those models overstate certainty and cash surprises follow.

Processing costs sit inside your margin

Interchange, Stripe fees, and take rate change the margin on every transaction, so we analyze cost efficiency line by line instead of using one blended software margin.

Revenue that moves with usage

Usage metering, seasonality, customer mix, and transaction timing shift monthly cash, so we plan revenue around volume scenarios instead of one straight line.

Headcount planned against each revenue stream

We measure CAC payback and sales capacity against license revenue and transaction revenue separately, so you hire against what each customer earns.

Cash forecast, financial forecast, and modeling analysis for B2B SaaS companies that process payments

Strategic finance for B2B SaaS companies that process payments

One finance function that answers the questions founders ask: how much cash we will have, what each customer earns after processing costs, and what we can afford to hire.

Learn more about pricing

What you get

Cash forecast and financial forecast

Rolling 12-month and long-range forecasts, budgets, and cash flow under strong, base, and slow volume cases. You see runway before transaction volume shifts it.

Financial modeling and cost efficiency analysis

Unit economics by revenue stream, plus customer profitability, retention, and expansion. Interchange, Stripe fees, and take rate are modeled as their own lines.

Revenue and headcount planning

Sales capacity models, commission plans, and funnel and channel analysis. Each hiring and spend decision is tested against cash before you commit.

$5,000

per month, company-wide analysis

$10,000

per month, department-level analysis

Learn more about pricing

A B2B SaaS platform processing $50M a month in payments ends a two-year stall and commits $2M to growth

Case study

$11M barbershop SaaS platform invests $2M in growth after financial rebuild

A bootstrapped B2B SaaS platform serving barbershop studios reached $11M ARR with $50M/mo in payments, then stalled for two years. Bridges converted the business to accrual under ASC 606 and built the forecasting that enabled a confident $2M go-to-market investment.

Read the case study

5 business days

monthly close

12-month

cash flow visibility

$2M

GTM investment committed

Tim Salikhov, The Payments CFO

Know what you keep on every payment, and make hiring, spend, and growth decisions with that number in hand.

Tim Salikhov, CFA

The Payments CFO

Meet the team

SaaS metrics, a rolling financial forecast, and cost efficiency analysis for B2B SaaS companies that process payments

Deliverable 1

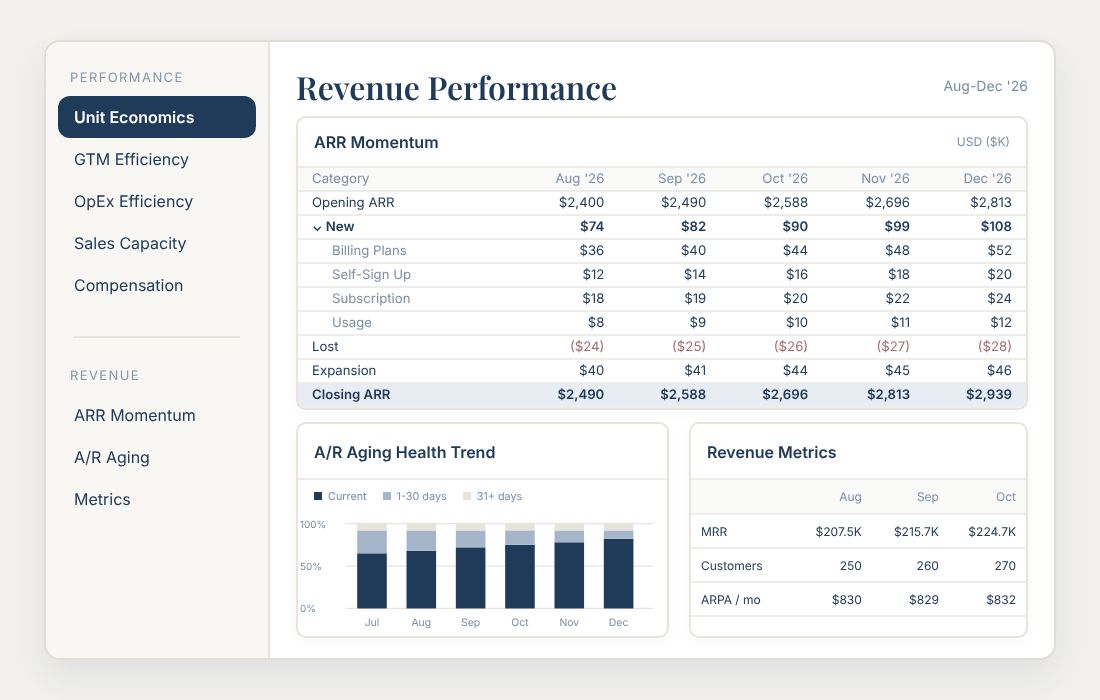
SaaS and payments metrics a board can trust

We report net revenue retention, take rate, and payment volume by customer, built from Stripe-reconciled data. Your board sees the same numbers your team runs the business on.
SaaS and payments metrics a board can trust preview
Deliverable 2

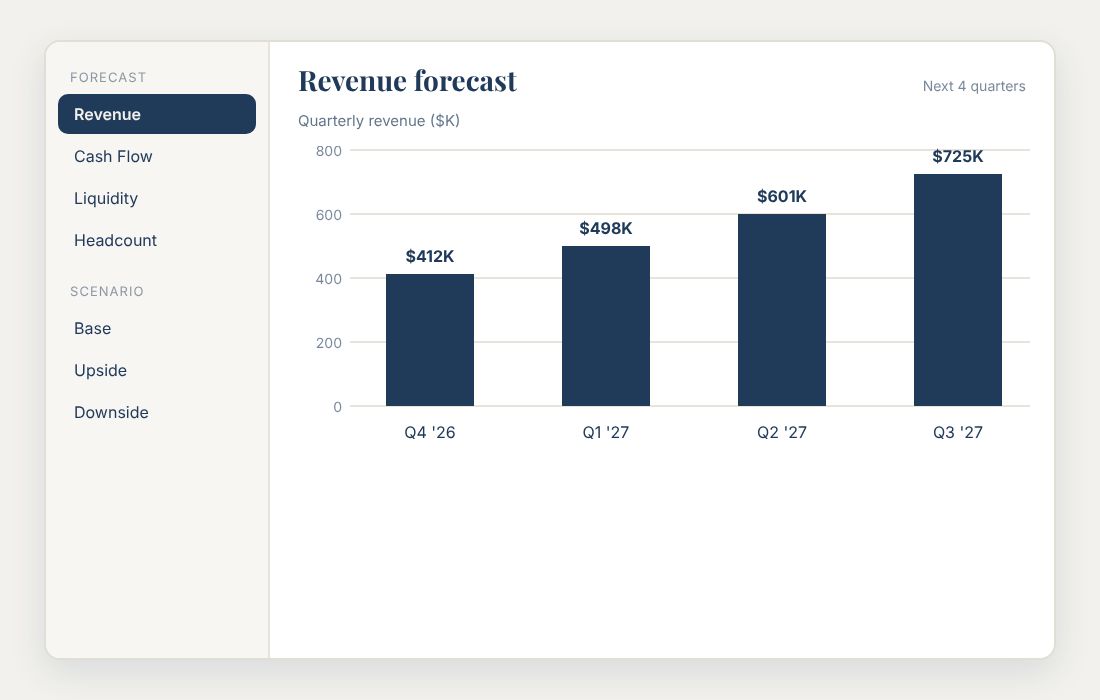
A rolling 12-month cash forecast

The forecast separates license, usage, and transaction revenue and shows cash under strong, base, and slow volume cases. You see runway before volume shifts, not after.
A rolling 12-month cash forecast preview
Deliverable 3

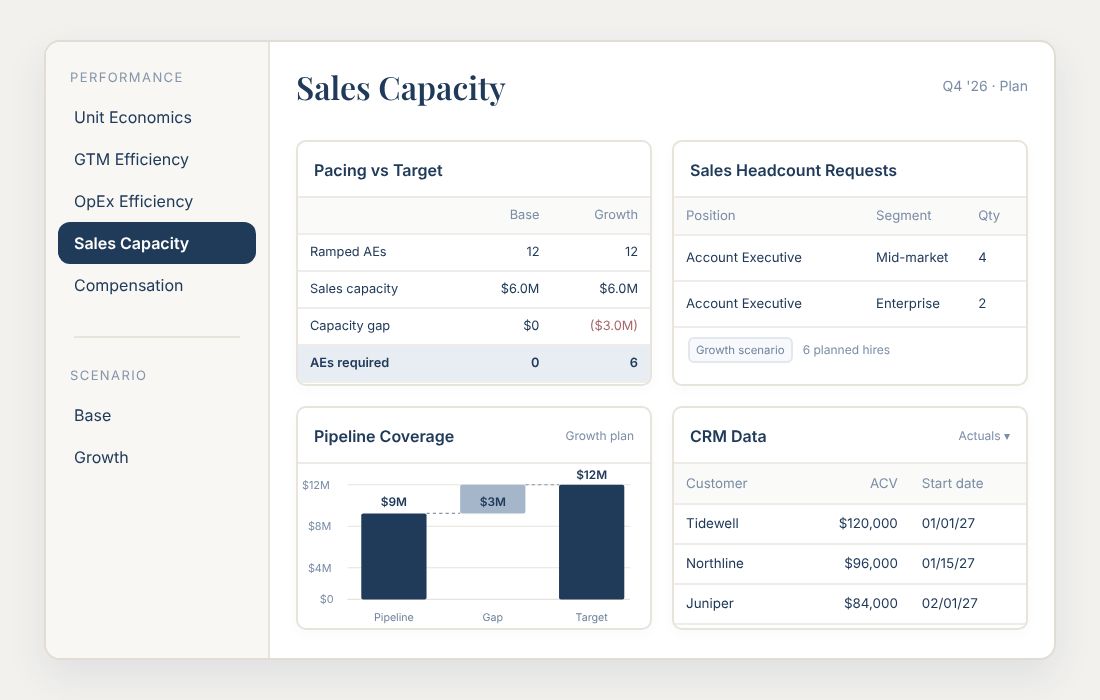
Cost efficiency and capital allocation analysis

Customer profitability, sales capacity, and marketing efficiency are analyzed by revenue stream. You see where the next dollar of spend earns the most.
Cost efficiency and capital allocation analysis preview

Trusted financials in week 1, a financial forecast by week 4, and analysis by the 10th business day each month

Agreements start with a three-month commitment, then continue month to month.

Week 1

Review

We review the accuracy of your financials, so every forecast starts from numbers you can trust.

Weeks 2–4

Build

We deliver your first financial analysis and forecast, including cash under strong, base, and slow volume cases.

Month 2 onward

Operate

Metrics analysis and updated forecasts arrive on a consistent cadence, by the 10th business day each month.

Plan revenue, cash, and headcount around what you earn on every payment

Talk with Tim Salikhov, the CFO on every Bridges engagement, about your forecast.

Book an Intro Call

Answers on cash forecasting, financial modeling, and pricing for B2B SaaS founders

What are strategic finance services for B2B SaaS companies that process payments?
Strategic finance for B2B SaaS companies that process payments is the work of forecasting cash, modeling revenue, and analyzing costs when income comes from both software contracts and customer transaction volume. Bridges delivers it as a rolling 12-month forecast, unit economics by revenue stream, and monthly metrics analysis, led by Tim Salikhov as CFO. It is built for companies with $3M–$30M in revenue that process payments through Stripe.
How do you build a cash forecast when revenue includes transaction volume?
Split revenue into license, usage, and transaction streams, then forecast each on its own driver: contract renewals for licenses, metered usage for usage fees, and customer payment volume for transaction revenue. Subtract processing costs such as interchange and Stripe fees from the transaction stream before it reaches gross margin. Then run strong, base, and slow volume cases so seasonality and payout timing show up as a range of cash outcomes instead of one line.
What does financial modeling and analysis cover, including take rate, interchange, and Stripe Connect costs?
The model covers take rate (the percentage of payment volume your company earns as revenue), interchange and Stripe fees (the costs that come out of it), and Stripe Connect fee and payout structures for platforms that move money between parties. It rolls these into margin by customer and by revenue stream, so you can see which customers are profitable after processing costs. The same model feeds pricing, sales capacity, and hiring scenarios.
How is strategic finance different from controller services and a fractional CFO?
Controller services produce accurate accrual-basis financials, including ASC 606 revenue recognition and Stripe reconciliation. Strategic finance uses those numbers to forecast, model, and analyze decisions on hiring, spend, and pricing. A fractional CFO adds board and investor reporting, fundraising, and exit readiness. Bridges runs all three under Tim Salikhov, so the forecast rests on books the same team closes.
When does a B2B SaaS company that processes payments need a dedicated financial forecasting function?
The need appears when payment volume starts moving monthly cash away from what the subscription plan predicts. Four triggers stand out: a hiring plan that outruns the cash forecast, a sales-team build, a fundraise or debt facility, or a cash miss two quarters in a row. Any one of them means the plan needs a model that treats transaction revenue and processing costs as their own lines.
How much do strategic finance services cost?
Strategic finance services are priced starting from $5,000 per month for company-wide analysis and starting from $10,000 per month for department-level analysis. The tiers differ in depth of work, not in services. Company-wide analysis covers cash flow and runway management, unit economics, and metrics and benchmarks with a monthly CFO cadence, while department-level analysis adds department P&L, flux analysis, annual budgeting, scenario planning, rolling forecasts, headcount and sales capacity planning, and quarterly board and investor updates with a bi-weekly CFO cadence. Full details are on the pricing page.
When do we get our first numbers, and what is the commitment?
You see reviewed financials in week 1 and working numbers, including a first analysis and forecast, within 30 days of the first call. Agreements begin with a three-month commitment, then run month to month, and you can scale services up or down with 30 days' notice. There is no equity, no benefits, and no onboarding fee. Bridges limits active engagements to between 8 and 12 at a time.